Introduction
The Nexus Viewer is the web application for exploring a world's data on a map. Anyone with the Viewer role can log in and browse it, without needing any programming knowledge.
How do you get to the Viewer?
- Go to https://nexus.stellaspark.com/
- Log in with your username and password
Info
Running into problems or odd behavior? Clear your browser cache, or open https://nexus.stellaspark.com/ in incognito mode.
What are themes and layers?
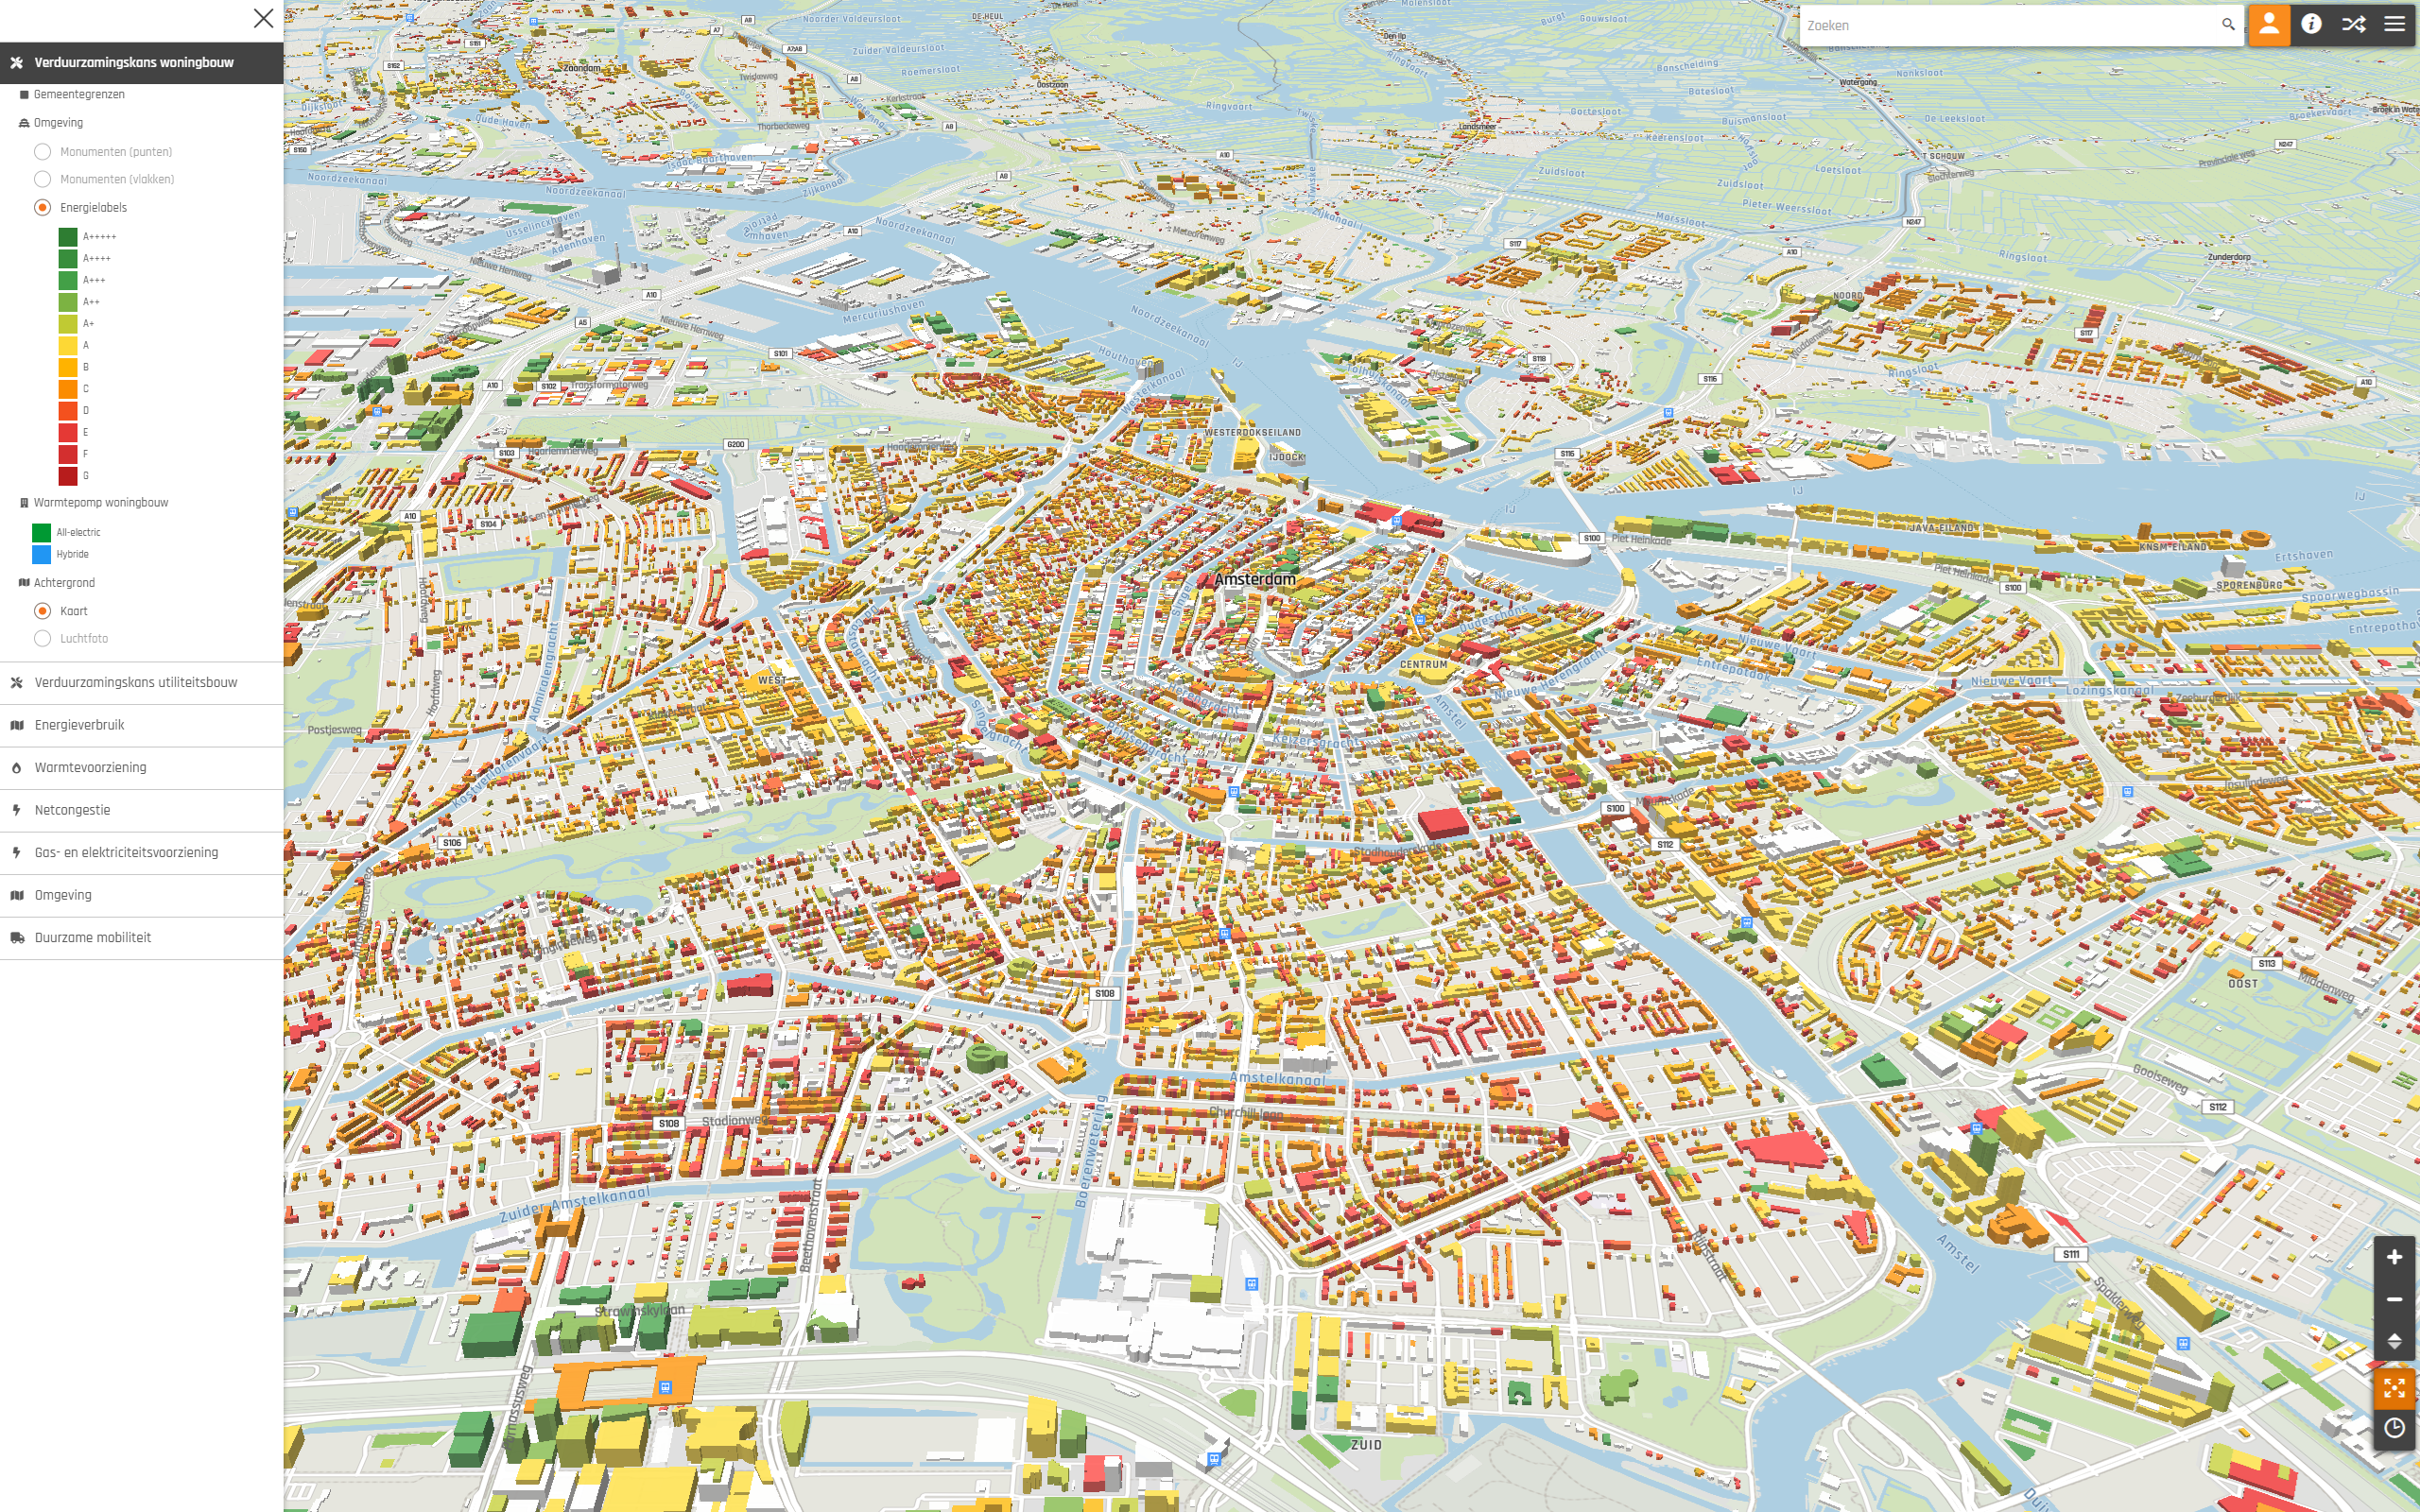
The panel on the left side of the Viewer lists themes and layers. A layer is a visualized slice of data on the map. A theme is a group of related layers that presents a specific topic of interest in a coherent way, for example an organization's policy goals, compliance aspects, or technical aspects. Only the themes you're allowed to see appear in your Viewer.
Functionality
- About world - introduction text about the world, plus an overview of its data sources and calculations. Open it from the "i" icon in the top toolbar.
- Feature info - click a feature on the map to see its underlying attribute data. If a layer is configured for it, this also opens the chart viewer, showing the feature's time series data as an interactive chart that can be zoomed and exported to CSV.
- Timeline - a button in the bottom right that shows the current date and time, with playback controls to step or play through time. Moving it filters any time-configured layers to the selected moment.
- 3D mode - hold the right mouse button and drag on the map to tilt it into a 3D perspective; click the compass to reset the view.
- Uploads - manually upload files to a data source. Requires the Data Supplier role. See Uploads.
- Scenarios - configure and run your own what-if simulations. Requires the Scenario Analyst role. See Scenarios.
- Data share - build a shareable link that exports feature, event and status data as CSV, GML or GeoJSON, or that opens a specific chart. Requires the Data Consumer role.